






01 / Economic Snapshot
02 / Scale & Prosperity
Metropolitan GDP
Nominal GDP, 2023 · USD billions
Per-capita income
City proper · Census QuickFacts, 2020–2024 · USD
Median household income
City proper · 2020–2024 · USD
Poverty rate
City proper · 2020–2024
03 / Economic Engines
Boston · Knowledge-intensive economy
A dense research and institutional ecosystem connects universities, hospitals, scientific discovery, and private-sector commercialization.
Life sciences Biotechnology Higher education Healthcare Technology FinanceMiami · International gateway economy
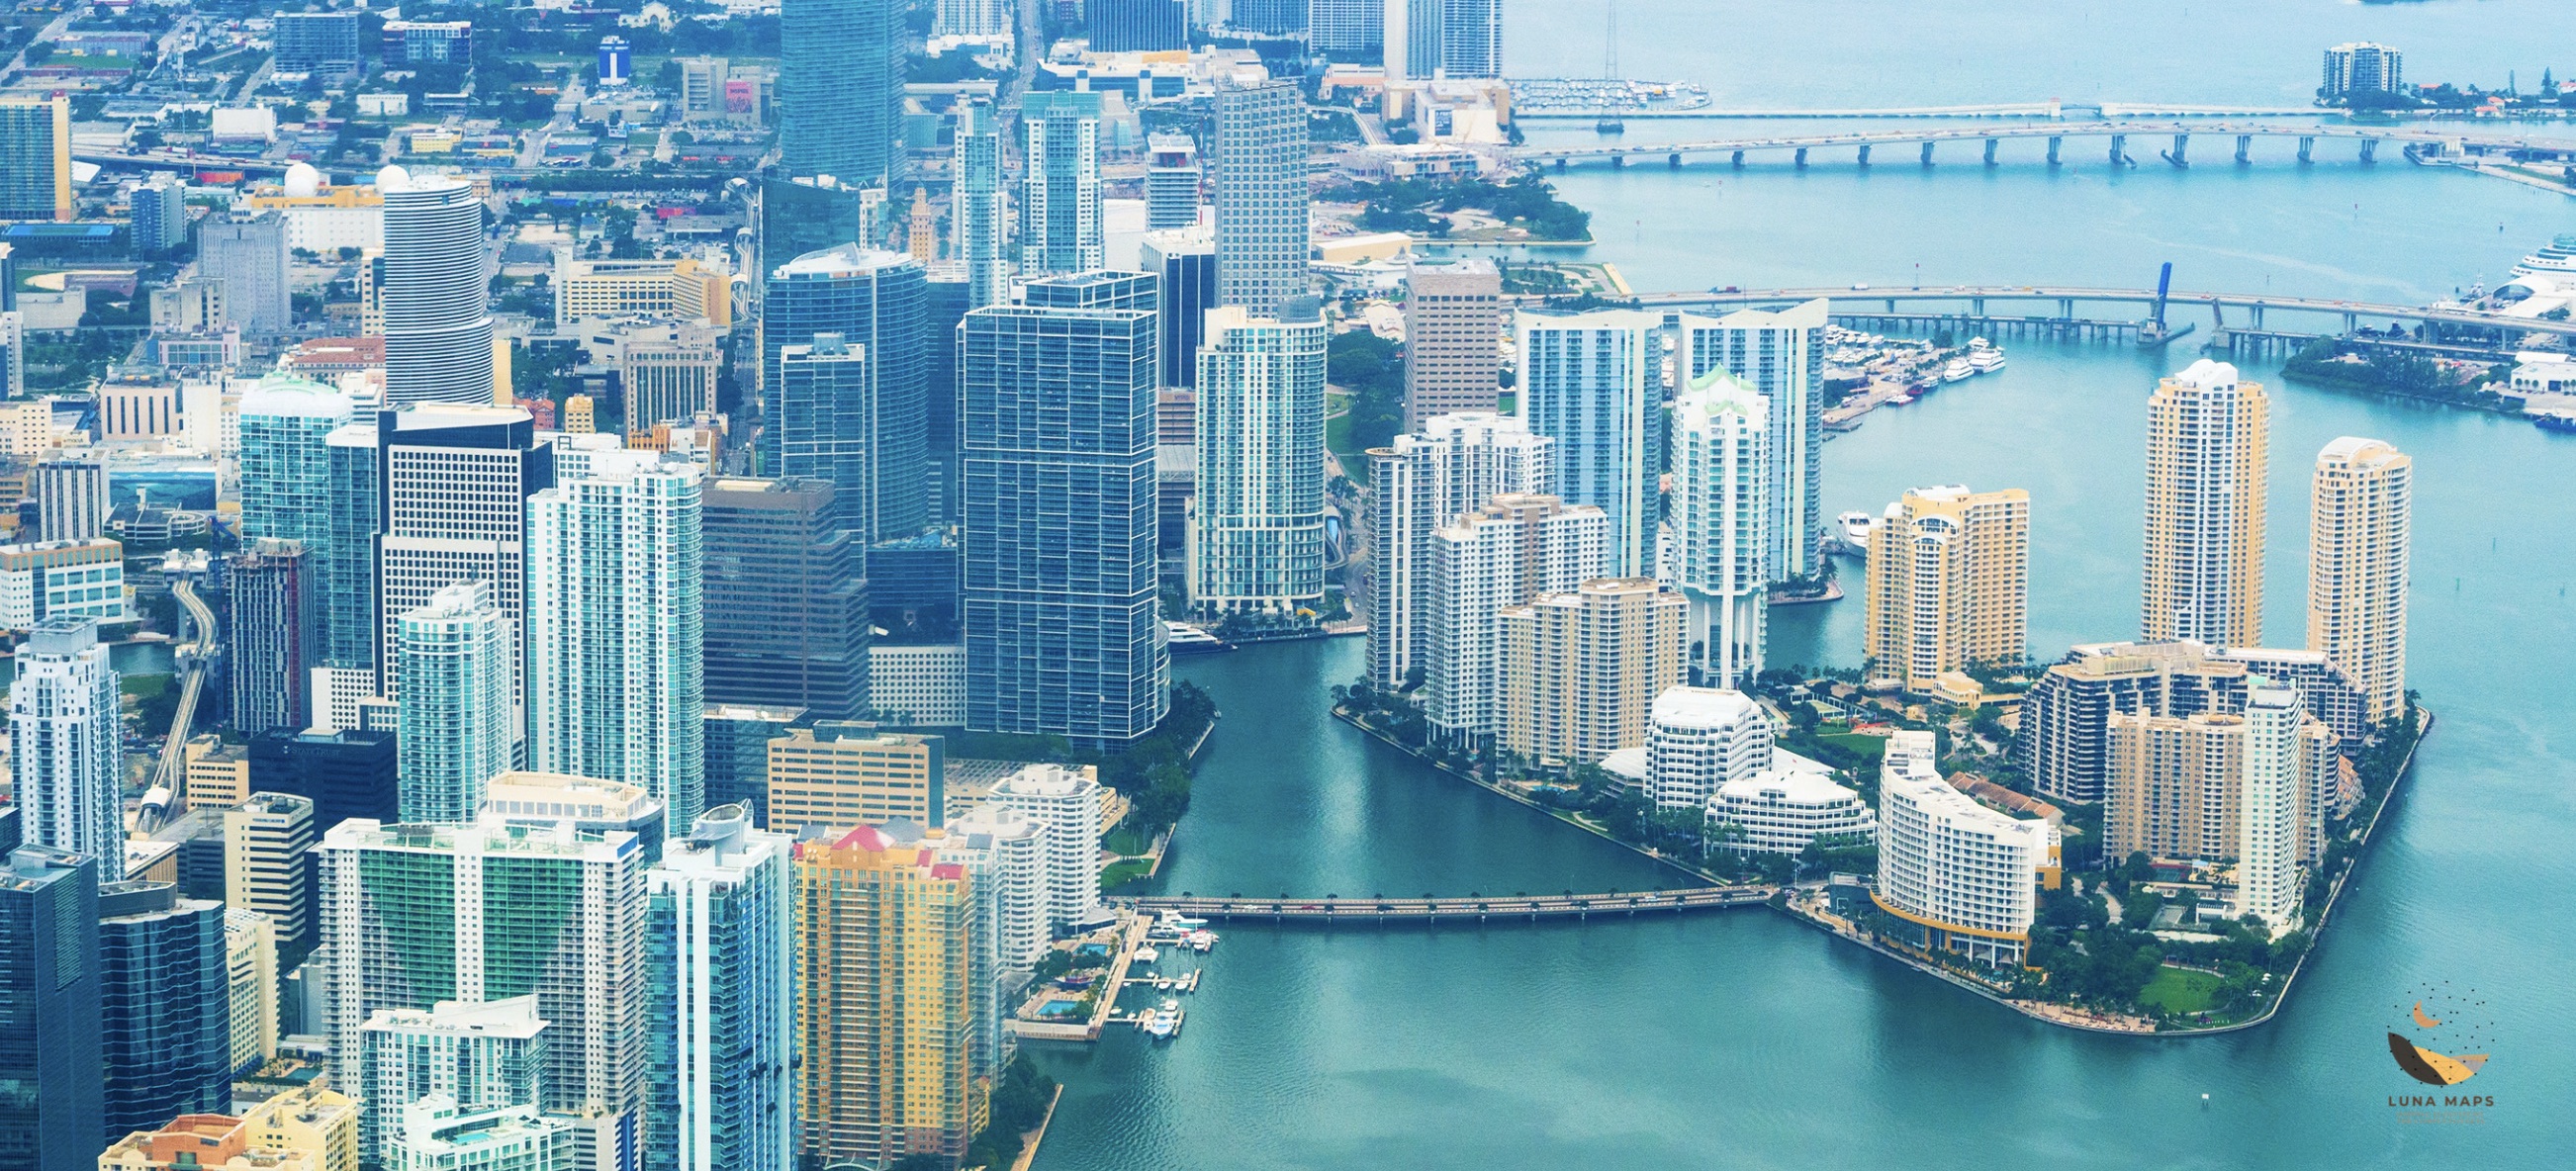
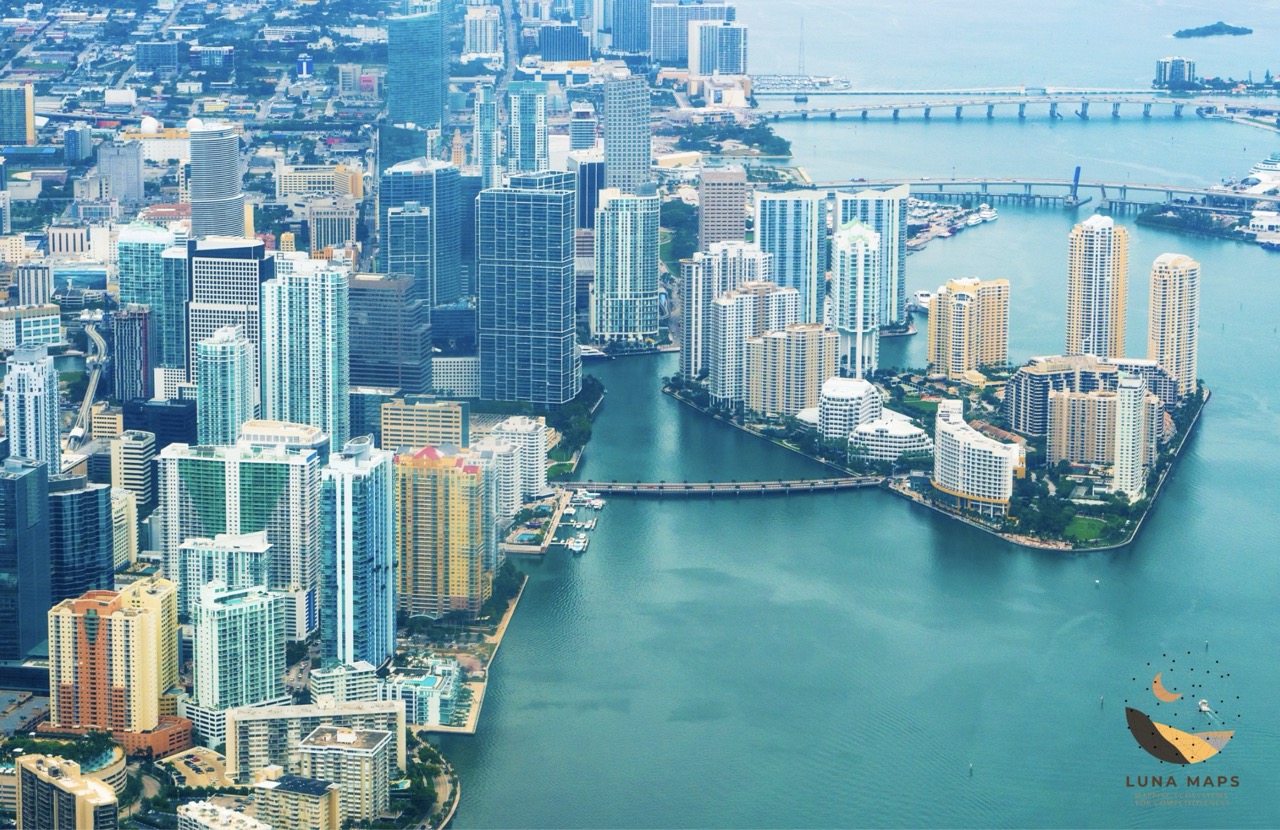
Global connectivity supports trade, logistics, tourism, real estate, finance, and emerging innovation sectors serving the Americas and international markets.
Trade & logistics Aviation Tourism Finance Healthcare TechnologyMiami · Reported net job gains by sector
May 2024–May 2025 · Approximate change in jobs, thousands. These are selected sectors, not the entire labor market.
From economic activity to economic prosperity.
Boston illustrates the value of connecting research, talent, institutions, and commercialization. Miami's international connectivity and sector diversity create a different opportunity: converting global access into higher-productivity industries, skilled employment, and broader income growth.
Capital follows talent. Talent finds ecosystems.
Sources & methodology
GDP figures are historical metropolitan estimates for 2023 and should be checked against the underlying BEA series before publication. Income and poverty figures are for the cities themselves, not their metropolitan areas. Employment changes use different reference periods and are not directly synchronized. Figures are not full-year 2026 results.
- U.S. Bureau of Economic Analysis
- BLS — Boston employment
- BLS — Miami employment
- Census QuickFacts — Boston
- Census QuickFacts — Miami
Before using this dashboard for an investment decision or public release, verify all figures against the latest source tables and document the geographic definitions.